Debug Console
The Debug Console lists Wrk Action executions from a Launch, showing the most recent executions by default. It is the main place to debug a Wrkflow: you can see which Wrk Actions ran, what outcome each execution finished with, and the inputs and outputs that passed through each step.
What the Debug Console shows
For a single launch, the Debug Console records:
- Wrk Action executions in Launch order, labeled with Wrk Action index and name (for example,
WA-1: Copy content) - Execution outcomes such as Success, Unsuccessful, Yes, No, No result, and Exception error, with completion timestamps
- Launch inputs from the trigger that started the Launch (manual launch, email, schedule, webhook, or API)
- Per-execution inputs and outputs when you expand an execution row
- Execution ID for each completed execution, a unique identifier you can share with support
By default, the Debug Console shows the last 50 Wrk Action executions created during the launch. It does not refresh automatically. Click Refresh while watching a live run to load newly created and completed executions.
The Debug Console complements the Launch Console. The Launch Console is a high-level activity timeline for the Launch. The Debug Console is the step-by-step record of every Wrk Action execution and its data.
How to open the Debug Console
The Debug Console opens when you enable Debug Mode on the Launch Console.
- Select a Wrkflow and the Launch you want to inspect.
- In the Launch Console header on the right, turn on the Debug Mode toggle.
The Debug Console panel appears beside the launch list. Because debug data can be lengthy, the panel is resizable.
You can also reach the Debug Console from a Launch row Actions menu on the Launches screen.
The Debug Console screen
After you select a Launch and enable Debug Mode, the dashboard shows the Wrkflow list, Launch history, Debug Console, and Launch Console together.
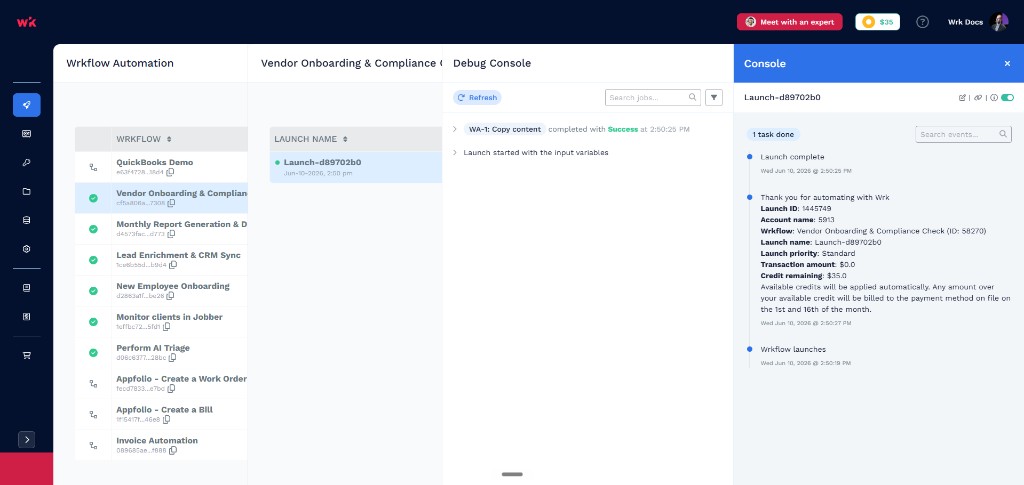
| UI element | What it tells you |
|---|---|
| Debug Console title | Identifies the debug panel for Wrk Action executions in the selected launch |
| Refresh | Reload the execution list; required during live Launches because the console does not update automatically |
| Search jobs | Filter Wrk Action executions by Wrk Action name or index (for example, WA-1 or Copy content) |
| Filter | Narrow the list by execution outcome |
| Execution rows | One row per Wrk Action execution, expandable to show inputs, outputs, and execution ID |
| Launch started with the input variables | Collapsed entry at the bottom of the list with trigger and launch input data |
Each execution row shows the Wrk Action index badge, Action name, outcome, and completion time. Executions still running show Queued with the time the execution was created.
You may see more than one execution for the same Wrk Action when a step runs multiple times in one Launch (for example, inside a loop).
Search and filter executions
Use Search jobs to find a specific Wrk Action by name or by the index shown on Action cards in the Wrkflow Designer (for example, WA-3).
Use the Filter control to limit the list by outcome, such as Success, Unsuccessful, Yes, No, No result, or Exception error.
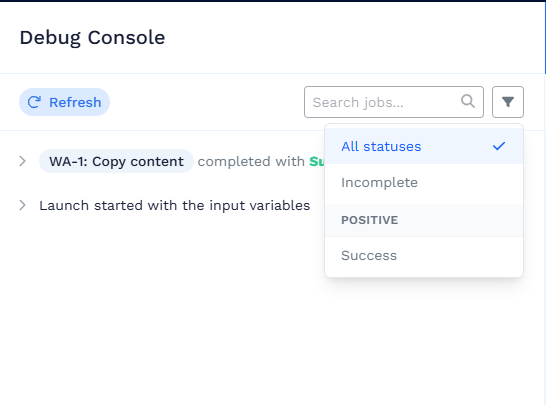
Filtering by outcome helps when a Wrkflow has many steps and you only want to review failures, incomplete executions, or a specific outcome branch. For how outcomes connect in the Wrkflow Designer, see Wrk Action Outcomes.
Inspect a Wrk Action execution
Click the chevron on an execution row to expand it. The expanded view shows the Execution ID, Inputs, and Outputs for that individual Wrk Action execution.
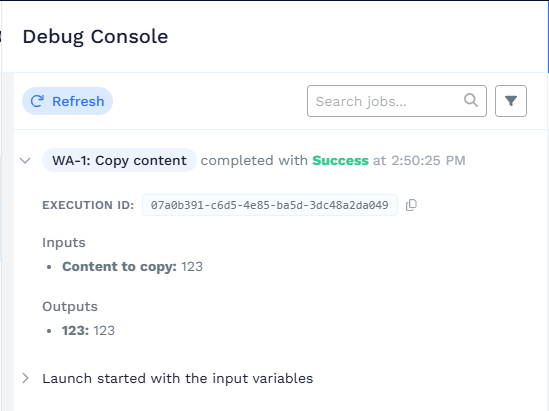
| UI element | What it tells you |
|---|---|
| Execution ID | Unique ID for this Wrk Action execution; copy it with the copy icon for support tickets |
| Inputs | Field names and values the execution received, including resolved Data Library values used in the Wrk Action |
| Outputs | Field names and values the execution produced |
| Outcome and timestamp | How the execution finished and when (for example, Success at 2:50:25 PM) |
If an execution completed with an error, the error message appears on the execution row.
File values include a download link. Connected Account values show which account was used; secret values such as passwords and API keys are not displayed. Empty inputs are hidden. Empty outputs appear with blank values.
Launch inputs
The Launch started with the input variables row at the bottom of the Debug Console holds the data sent into the Wrkflow when the Launch began.
Expand this row to see launch inputs from any trigger type:
- Manual launch from the UI or Launch Control
- Email trigger
- Scheduled launch
- Webhook
- API launch
Use this entry to confirm that trigger data arrived correctly before you trace individual Wrk Action executions.
Execution ID and support
Each expanded Wrk Action execution includes an Execution ID: a unique identifier for that single execution, separate from the Launch ID shown in the Launch Console billing summary.
If you need help understanding what happened with a specific step, copy the Execution ID and the launch deep link from the Launch Console (Copy deep link in the header). Share both with Wrk support so they can open the exact launch and look up the Wrk Action execution.